

A Deployment Diagram is a Structural UML Diagram that represents the physical deployment of software components on hardware nodes. It shows how software is distributed across devices such as servers, processors, and network infrastructure.
- Illustrates where software components are deployed and executed within the hardware environment.
- Shows communication and connections between hardware nodes and deployed software components.
Example: In a web application, the web server, application server, and database server can be shown as separate deployment nodes. The diagram illustrates how these nodes communicate to deliver application services to users.
Elements of a Deployment Diagram
Deployment Diagrams consist of several elements that represent the physical infrastructure and software deployment of a system.
- Nodes: Physical hardware devices such as servers, workstations, routers, or mobile devices where software is deployed.
- Components: Software modules, services, or applications that run on the nodes.
- Artifacts: Physical files such as executables, libraries, scripts, databases, and configuration files deployed on nodes.
- Dependencies: Show communication paths and relationships between nodes and components.
- Associations: Indicate which components are deployed on specific nodes.
- Deployment Specifications: Define configuration details, hardware requirements, software settings, and communication protocols.
- Communication Paths: Represent network connections and channels used for interaction between nodes and components.
Components and Notations in Deployment Diagram
Below are the components and their notations in deployment diagram:
1. Component
A component is a modular and reusable part of a system that encapsulates specific functionality, data, and behavior. It can be developed, deployed, and maintained independently within a software application.
- Represents a self-contained unit such as a module, class, or package that performs a specific function within the system.
- Typically shown as a rectangle with two small protruding rectangles on its side, with the component name written inside the symbol.

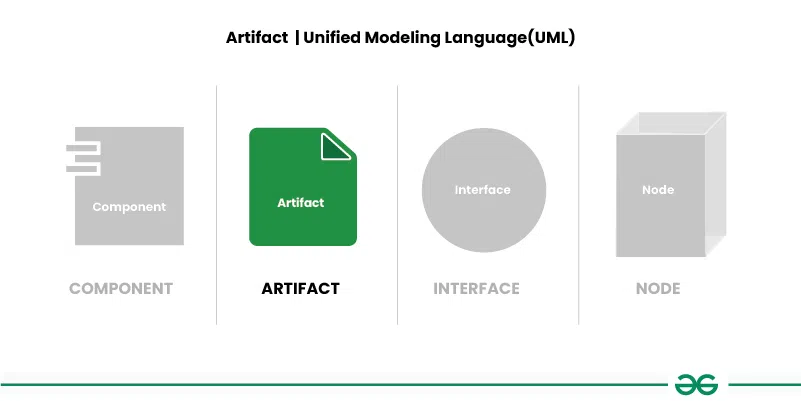
2. Artifact
An artifact is a physical piece of information or data created, used, or produced during the software development process. It can represent source code, executables, documents, libraries, or configuration files.
- Represents deliverables such as source code files, compiled applications, documentation, or configuration resources used in a system.
- Typically shown as a rectangle with a folded corner, containing the artifact name and optionally additional details such as version numbers or file extensions.
3. Interface
An interface defines a contract that specifies the operations or methods a component must implement. It serves as a communication point between different components or subsystems.
- Defines the services a component provides or requires, enabling interaction without exposing internal implementation details.
- Typically represented as a circle or ellipse labeled with the interface name, and may indicate provided or required interfaces using symbols such as "+" and "-".

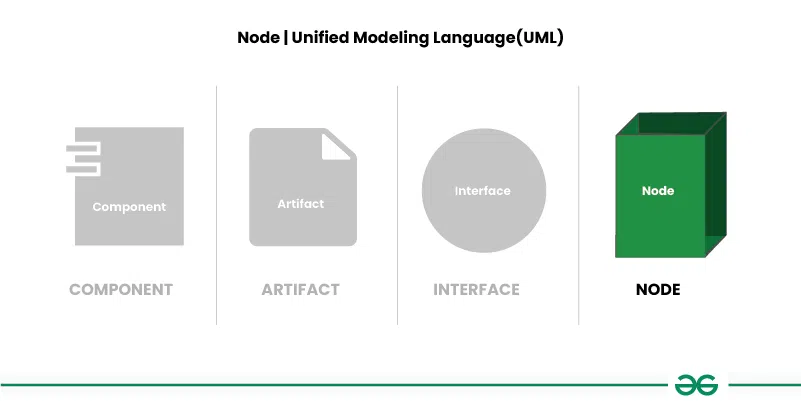
4. Node
A node represents a physical or computational resource where software components are deployed and executed. It can be a server, workstation, hardware device, or any computing resource within a system.
- Represents the execution environment that hosts applications, services, databases, or other software components.
- Typically shown as a box with rounded corners labeled with the node name, and may contain nested nodes to represent hierarchical structures.
5. Communication path
A communication path represents the connection through which two nodes exchange information in a deployment diagram. It shows how devices or resources communicate within the system.
- A solid line is used to indicate a communication link between two device nodes, enabling data transfer and interaction.
- Dashed lines represent dependencies or relationships, showing that one element relies on or is associated with another element.

Real-World Examples
Below are the real-world examples for deployment diagram:
Example 1
Deployement Diagram For Mobile Banking Andorid Services.
In this example, one node represents the client’s Android device. The components represent the software installed on these devices, with the banking application being the specific component on the Android device.
.webp)
The explanation of the above example is:
- Android Device Node: Represents the client's mobile device where the banking application is installed and executed.
- Banking Application Component: The software component running on the Android device that provides banking services to the user.
- Banking Server: Acts as the backend system that processes requests, manages accounts, and handles transactions.
- Web Connection: Shows the communication path between the banking application and the banking server over the internet.
- User Operations: Users can perform tasks such as checking account balances, viewing transaction history, and transferring funds through the application.
Example 2
Deployement Diagram For Online Exam Registration System.
The online exam registration process typically includes a series of features designed to streamline and simplify the registration experience for users. After logging in or registering for an account, users can browse and select their desired exam from a list of available options.
.webp)
The explanation of the above example is:
- Login or Registration: Users access the system by logging in with existing credentials or creating a new account by providing personal details.
- Select Exam: Users choose an exam, view available dates and locations, and verify eligibility requirements.
- Manage Profile and Status: Users can update profile information, check registration status, and access registration-related details.
- View Profile: Allows users to review and modify personal information, print e-receipts, and save profile changes.
- Payment: Users pay the examination fee through available payment methods such as cards, net banking, or digital wallets.
- Test: Registered users may access sample tests or practice papers to prepare for the examination.
- View Result: After the exam, users can log in to view their results and performance details.
- Report: The system provides reports such as scorecards, response sheets, and feedback forms based on exam policies.
Use Cases of Deployment Diagrams
The use cases of deployment diagrams are:
- Deployment diagrams help plan how software systems will be set up on different devices.
- They help design the hardware needed to support the software. By showing which software parts go where, they help decide what devices and networks are needed.
- Deployment diagrams make sure each part of the software has enough resources, like memory or processing power, to run well.
- They show how different parts of the software depend on each other and on the hardware.
- By seeing how everything is set up, teams can find ways to make the software run faster and smoother.
Benefits of Deployment Diagrams
The benefits of deployment diagram are:
- Deployment diagrams provide a clear picture of how software parts are placed on hardware, making it easy to understand
- They help teams talk about how to set up the system, making it easier to discuss and decide on deployment strategies.
- Deployment diagrams assist in planning and managing the deployment process, ensuring resources are used efficiently and system requirements are met.
- They serve as useful documentation for understanding how the system is set up, helping with maintenance and future changes.
Challenges of Deployment Diagrams
The challenges of deployment diagram are:
- Deployment diagrams can get complicated and especially in big systems with lots of parts. Managing this complexity is tough.
- Making and understanding deployment diagrams needs knowledge of UML symbols, which not everyone might have.
- Updating deployment diagrams when the system changes takes time and effort.
- Deployment diagrams might not show how things change over time or in real-life use.
- Making deployment diagrams often needs lots of people to work together, which can be tricky.
