

Relational plots are used to visualise relationships between variables in a dataset. They help identify trends, patterns and correlations between data points. Seaborn provides several functions for creating relational plots, including relplot(), scatterplot() and lineplot().
Implementation
1. Import Required Libraries
- Seaborn for creating relational plots.
- Matplotlib for displaying the plots.
import seaborn as sns
import matplotlib.pyplot as plt
2. Load the Dataset
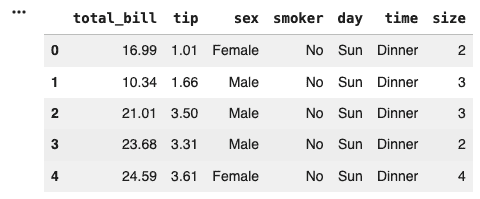
The built-in tips dataset is loaded.
tips = sns.load_dataset("tips")
tips.head()
Output:
3. Create a Basic Relational Plot
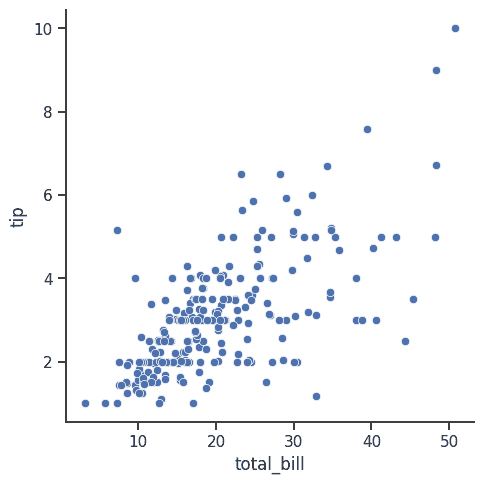
This creates a simple relational (scatter) plot.
- Shows the relationship between total bill and tip.
- Each point represents one observation.
- Helps identify trends between the two variables.
sns.set(style="ticks")

sns.relplot(
    x="total_bill",
    y="tip",
    data=tips
)

plt.show()
Output:
4. Group Data Using Hue
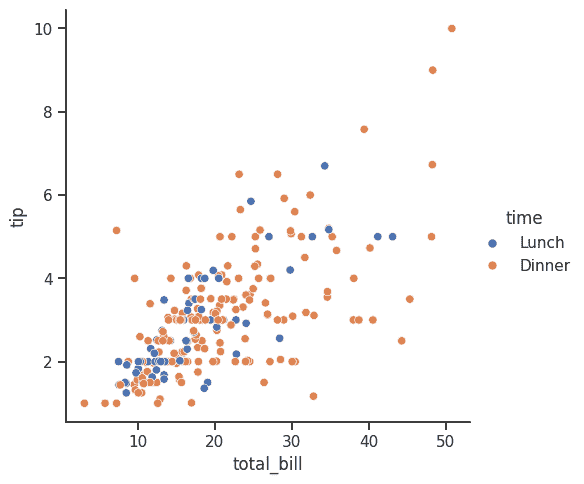
The hue parameter separates data points using different colors.
- Distinguishes between Lunch and Dinner customers.
- Makes category wise comparisons easier.
sns.relplot(
    x="total_bill",
    y="tip",
    hue="time",
    data=tips
)

plt.show()
Output
5. Create Faceted Relational Plots
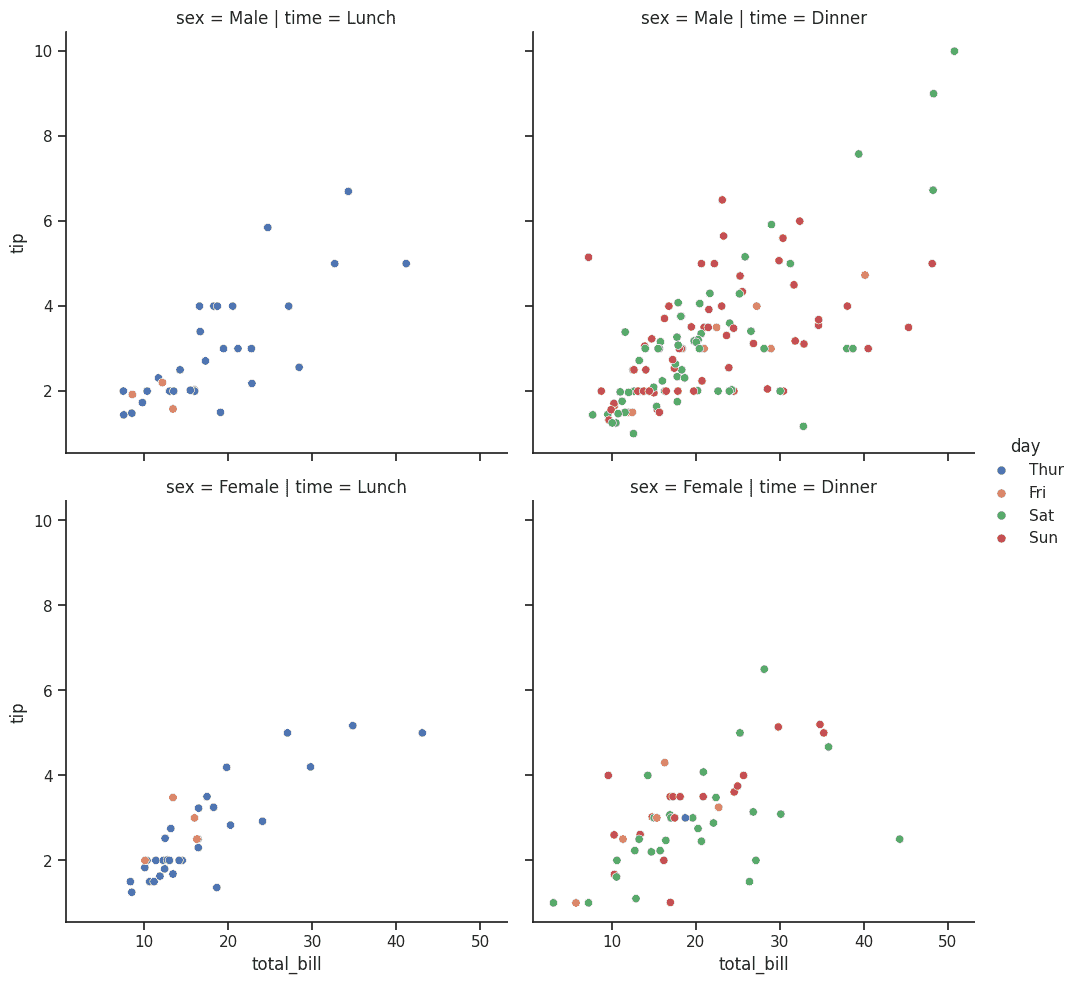
This creates multiple plots based on categories.
- row="sex" creates separate rows for males and females.
- col="time" creates separate columns for lunch and dinner.
- Allows comparison across multiple categories simultaneously.
sns.relplot(
    x="total_bill",
    y="tip",
    hue="day",
    col="time",
    row="sex",
    data=tips
)

plt.show()
Output:
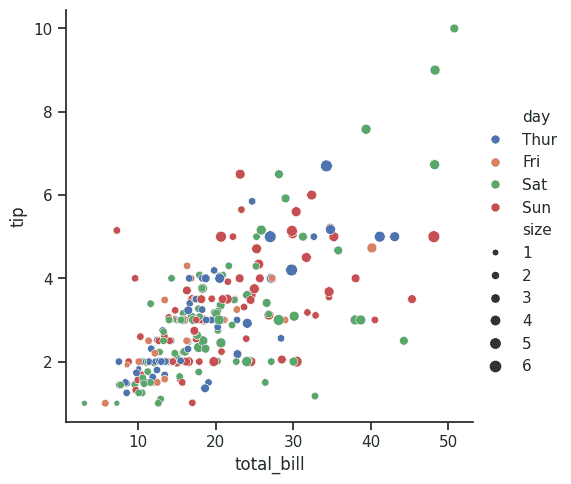
6. Use Different Point Sizes
The size parameter changes the marker size according to the group size.
- Larger points represent larger groups.
- Adds an extra dimension to the visualization.
sns.relplot(
    x="total_bill",
    y="tip",
    hue="day",
    size="size",
    data=tips
)

plt.show()
Output:
7. Create a Line Relational Plot
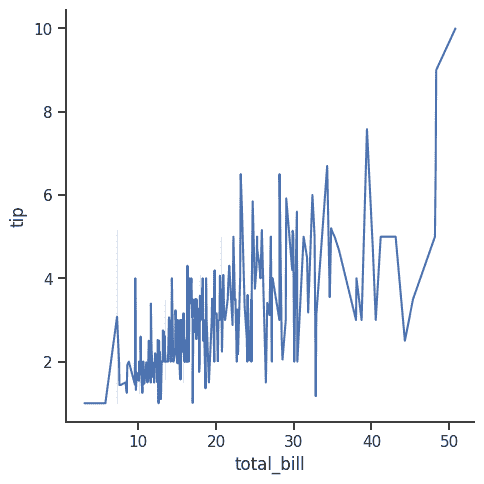
This creates a line plot instead of a scatter plot.
- Shows trends and patterns in the data.
- Useful for analyzing changes between variables.
sns.relplot(
    x="total_bill",
    y="tip",
    kind="line",
    data=tips
)

plt.show()
Output:
Download fullcode from here
